AimerPayOCT 2026 / PROGRESS REPORT
AIMERPAY / COMMERCIAL UPDATE / OCTOBER 2026
New ZealandAustralia

More merchants.
More payments.

A new revenue stream,
built into everyday commerce.

Explore October outlook ↗
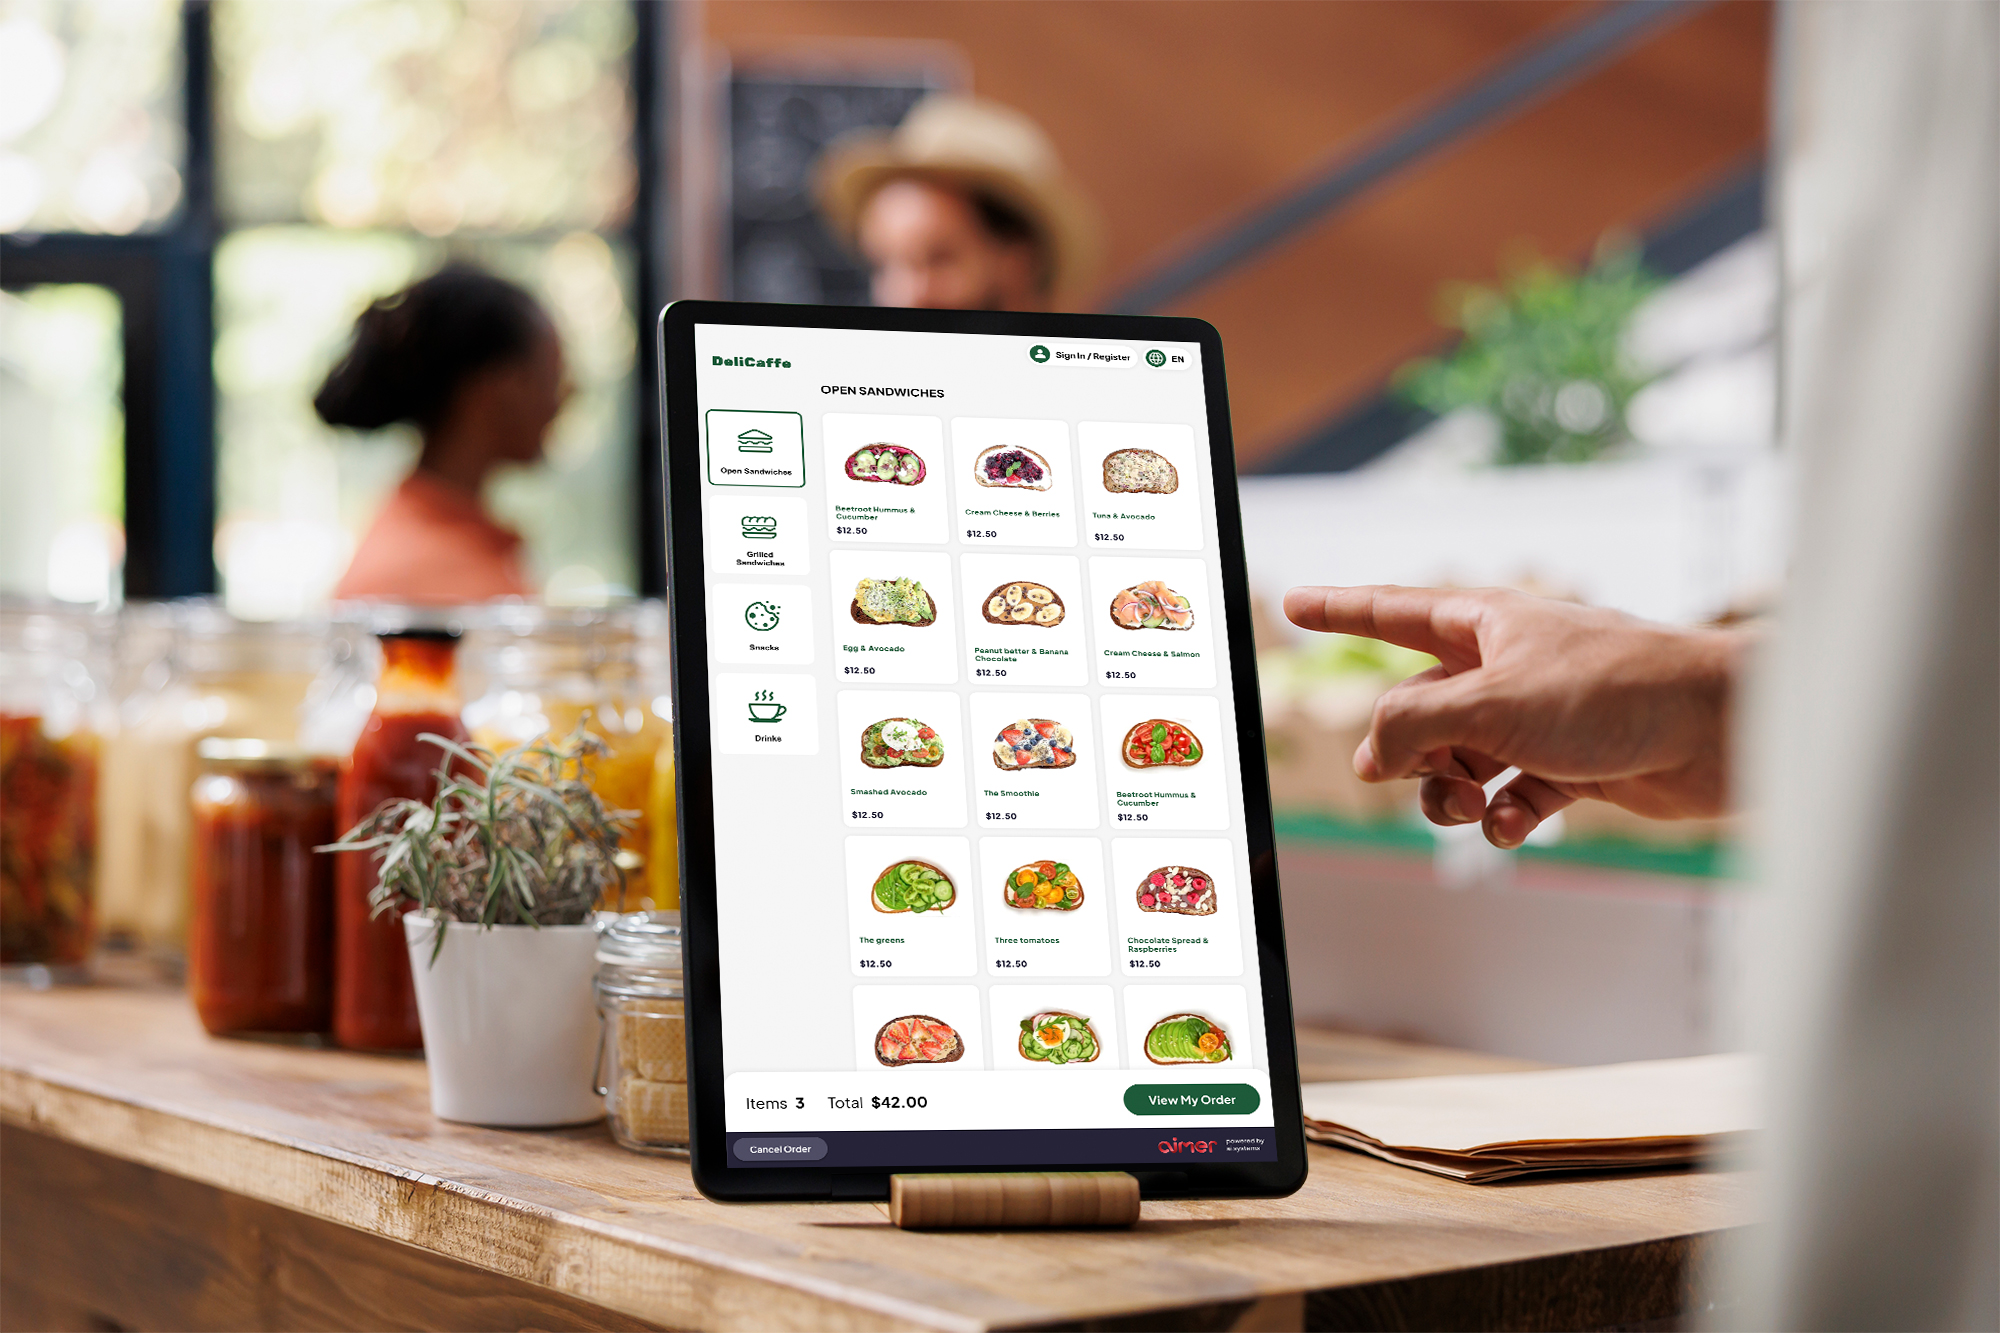
Aimer self-ordering screen in a cafe, from the AutoFront brochure
AIMER PRODUCT EXPERIENCETap. Order. Pay.
SEPTEMBER / ACTUAL GPV

Two markets.
One commercial direction.

NEW ZEALAND · NZDNZ$258,984↗ 28.5% month on month
AUSTRALIA · AUDA$158,953↗ 5.6% month on month
Captured payment volume · September full month · Before refunds · Data through 6 October 2026
THE EXPERIENCE BEHIND THE NUMBERS

Built for the
moment of payment.

Ordering, checkout and payment
within Aimer's merchant ecosystem.

Self-service orderingIntegrated checkoutIn-store payments
Product imagery from Aimer's Figma brochure library.
Illustrative design visuals, not deployment evidence.
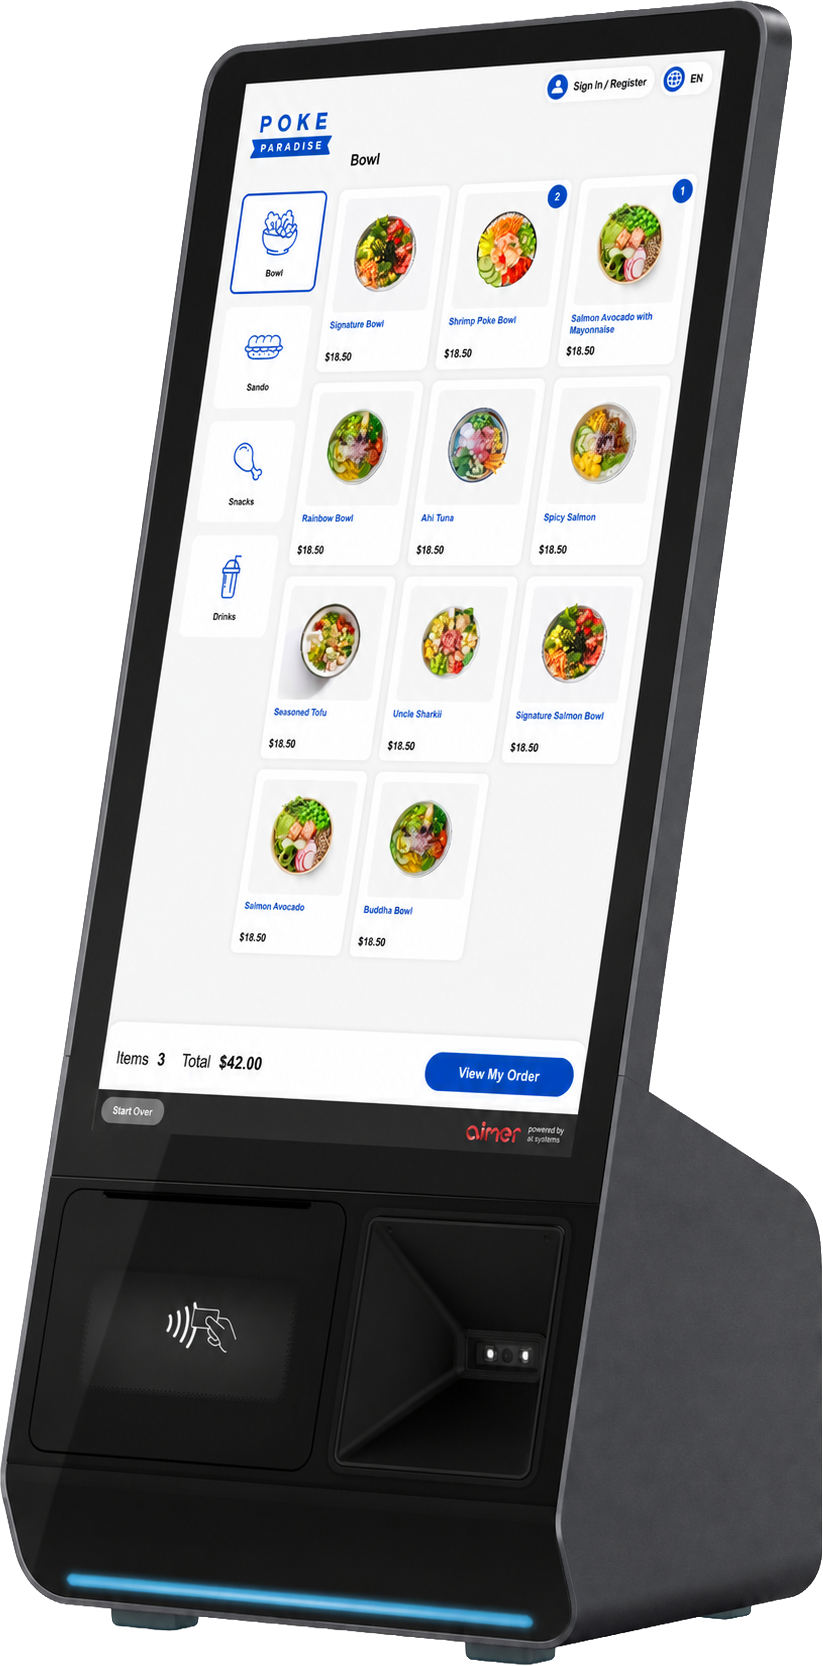
Aimer PK156 self-ordering kiosk with integrated contactless payment area
PK156 / SELF-SERVICE EXPERIENCE
01 / ACTIVATION

From onboarding
to payment activity.

93 tracked customer records.
56 with successful payment evidence.

TRACKED CUSTOMER RECORDS
93↗

76 New Zealand / 17 Australia

NEW ZEALANDNZ
46/ 76

with successful payment evidence

30 records without matched payment evidence
AUSTRALIAAU
10/ 17

with successful payment evidence

7 records without matched payment evidence
01 Agreement→02 Merchant setup→03 Activation→04 Repeat processing

Payment evidence includes small test transactions; these counts do not establish recurring active merchants. Records are deduplicated.

02 / OCTOBER OPERATING PRIORITIES

NZ: deepen usage.
AU: expand rollout.

From technical readiness
to more payments through AimerPay.

NEW ZEALAND

Rollout complete.
Penetration is next.

14.6%September actual · 39-store matched cohort
→
29.1%Doubling target · +100% relative to September
01 / Early constraint

Tap-to-pay-only capability meant merchants used AimerPay alongside traditional terminals.

02 / Technical update

Management reports that standard card-payment capability is now enabled. October focuses on migrating more payment activity to AimerPay.

AUSTRALIA

Activate more merchants.
Retain high usage.

≈100%Current activated merchants
Management operating estimate

October rollout is scaling. The focus is on activating merchants while maintaining high AimerPay usage.

+5Additional merchants
in the October scenario
September matched-cohort actual: 15.9% across 9 stores. This historical metric is not directly comparable to management's current activated-merchant estimate.

Penetration = AimerPay all-channel GPV ÷ POS-recorded turnover for the same matched cohort. It is not take rate, profit margin or terminal-only share. NZ rollout and technical resolution are management updates; the historical data do not independently prove causation.

03 / PROCESSING TRACTION

Two markets.
Growing payment volume.

July–September actuals + October forecast
Planning range · penetration uplift + merchant additions.

New Zealand

NZD
5.45×September vs July volume

Australia

AUD
4.12×September vs July volume
July–September actualsOctober lower scenarioOctober range to upper scenario

October is an illustrative planning range, not a confidence interval or a guaranteed minimum. The outlined upper band shows the difference between slower and stronger execution.

OCTOBER / PLANNING RANGE

Usage deepens.
Rollout expands.

NZ: penetration doubling target + 15 merchants.
AU: ongoing rollout + 5 merchants.

Scenario estimates, not revenue guidance or commitments.
NEW ZEALAND · NZD GPVNZ$422k–581k

21.8%–29.1% full-month average penetration
+ 15 incremental merchant activations

29.1% is a 100% relative increase from September's 14.6%, not a 100-percentage-point increase.
AUSTRALIA · AUD GPVA$762k–983k

80%–100% of current daily pace after 6 October
+ 5 incremental merchant activations

Actual 1–6 October GPV is retained in both scenarios.
What drives the range
AssumptionSlower executionStronger execution
NZ average penetration21.8% · half the targeted uplift realised29.1% · full doubling realised
NZ / AU new merchants+15 / +5+15 / +5
New merchant first-month processing50% of benchmark100% of benchmark
Assumed activation timing16 October · 16 calendar days16 October · 16 calendar days
AU remaining-month daily GPV80% of 1–6 October daily average100% of 1–6 October daily average

NZ uses the same 39-store September POS turnover base (NZ$1,743,721), held flat for October. Doubling September's unrounded penetration produces 29.12%; slower execution assumes only half the targeted uplift is realised in the monthly average (21.84%). Neither rate is presented as achieved. New activations are additional to the 6 October snapshot and outside the existing forecast cohorts.

Forecast bridge and merchant benchmark +

NZ: existing cohort GPV NZ$380,846–507,795 + other existing processing NZ$9,295 + new merchant GPV NZ$32,080–64,160 = NZ$422,222–581,251.
AU: 1–6 October actual GPV A$154,408 + remaining-period GPV A$514,692–643,365 + new merchant GPV A$92,800–185,600 = A$761,899–983,372. Components use unrounded values.

New merchant contribution = additions × daily benchmark × 16 calendar days × 50%–100%. Daily benchmarks are the market medians from 1–6 October: NZ$1,604 ÷ 6 and A$13,919.965 ÷ 6. Cohorts contain 23 NZ and 8 AU matched customers with at least 100 local-currency GPV in the six days. The threshold is a modelling choice, not proof of recurring activity. No additional penetration multiplier is applied to the new merchant benchmark. Delayed activations, lower turnover or slower adoption can result in outcomes below this range.

EARLY OCTOBER / 01–06 OCT ONLY

Australia’s next signal.

Six days of volume equal 97.1% of the full September total.

Partial period observation, not a monthly forecast.
AUSTRALIAA$154,408
NEW ZEALANDNZ$54,600

Processing volume, 1–6 October

04 / PAYMENT CHANNELS

Built around the way
merchants get paid.

September 2026
Share of processing volume.

New Zealand

55.4%32.6%12%

POS NZ$143,557

Tap to Pay NZ$84,387

eCommerce NZ$31,039

Australia

95.7%

POS A$152,039

Tap to Pay · 4.3% A$6,914

eCommerce A$0

05 / OTHER REVENUE · ILLUSTRATIVE MODEL

Volume becomes
revenue potential.

Processing volume × assumed retained take rate.
Illustrative income, not recognised revenue or profit.

0.65%
0.50%0.80%

Every 100,000 processed generates an illustrative 500–800 in the same currency.

NEW ZEALAND

AUSTRALIA

The assumed retained rate is a scenario, not a verified realised rate or the merchant fee. Australian activity is group commercial progress; it is not automatically revenue recognised by the New Zealand grant applicant.

06 / RECENT CONTRACT EXAMPLES

Commercial progress,
supported by agreements.

Internal contract collection ↗

Selected recent agreements, not the full portfolio. Contract links require authorised DocSend access. Agreement dates do not by themselves establish a new customer or live processing.

07 / THE COMMERCIAL PICTURE

AimerPay is processing
in New Zealand and Australia.

01New Zealand: grow penetration
after technical readiness.

02Australia: scale rollout
and sustain merchant usage.

03A retained take rate creates
an incremental income opportunity.

Sources, definitions & reporting boundaries +

Design assets. Aimer logo sourced from Presentation Assets in Figma ↗. New cafe ordering and PK156 visuals are original assets from Flyer Ideas / Final Design ↗. Brochure product visuals illustrate the experience, not a specific deployment.

Source snapshot. AimerOps handoff dated 9 October 2026, including the progress checklist and payment data through 6 October; OPS dashboard ↗; selected customer agreements linked above.

Processing definition. Adyen Standard + LowATV successful captured statuses (SentForSettle, Captured PC), before refunds. Processing volume is not Aimer revenue. AUD totals include A$12.06 of internal activity across July–6 October.

Comparability. July–September are complete months; October actuals cover days 1–6. The forecast uses a scenario range, not a probability distribution or guaranteed floor. Processing GPV is not Aimer revenue. NZD and AUD are never summed. Whole-market NZ September GPV is NZ$258,983.70, while the matched 39-store penetration cohort is NZ$253,897.59. Use each with its correct denominator. NZ customer-list September totals differ from the dashboard by NZ$90.09 of unmatched activity.

POS & penetration update. AimerOps POS turnover and penetration handoff dated 9 October 2026. POS source coverage: 75 customers (58 NZ / 17 AU), not all eligible for penetration. September matched samples: NZ 39 customers, GPV NZ$253,897.59 / POS NZ$1,743,721.14 = 14.6%; AU 9 customers, GPV A$158,951.48 / POS A$998,267.65 = 15.9%. These denominators differ from whole-market GPV. Matched identity does not establish transaction-by-transaction reconciliation. September ratios above 100% for Kumo Desserts and ChaPanda remain in the source summary and require scope reconciliation.

NZ range calculation. September penetration = NZ$253,897.59 ÷ NZ$1,743,721.14 = 14.560676%. The target is a 100% relative increase (2×), or 29.121353%. The lower scenario captures half that uplift in the October monthly average (21.841014%). The September POS turnover denominator is held flat, with no 31/30 uplift. Cohort October GPV = September cohort GPV × 1.5–2 = NZ$380,846.385–507,795.18. Other existing activity = (NZ$54,599.75 − NZ$52,800.63) ÷ 6 × 31 = NZ$9,295.4533. Fifteen incremental merchants are assumed to start on 16 October at 50%–100% of the daily median: 15 × NZ$1,604 ÷ 6 × 16 × 0.5–1 = NZ$32,080–64,160. Total NZ$422,221.8383–581,250.6333. The matched-cohort forecast replaces its current run rate; it is not added to it. The 29.1% target is distinct from the assumed full-month average; reaching it only at month-end does not imply that average.

AU range calculation. Retain A$154,407.53 of actual GPV for 1–6 October. Remaining 25 days = A$154,407.53 ÷ 6 × 25 × 0.8–1. Five incremental merchants start on 16 October at 50%–100% of the daily median: 5 × A$13,919.965 ÷ 6 × 16 × 0.5–1. Total A$761,899.0633–983,371.7717. The 20% remaining-period reduction and new-merchant ramp factors are analyst sensitivities, not calibrated probabilities. AU near-100% penetration is not multiplied into GPV again.

Scenario boundaries. The additions of 15 NZ and 5 AU merchants are management assumptions, incremental to the 6 October snapshot and outside the existing cohorts. Activation timing and merchant productivity are unverified; figures can fall below or exceed the range. New-merchant daily medians come from nz-final-ranking.json and au-customer-matched-jul-oct.csv in the 9 October handoff. Sample: 23 NZ / 8 AU customers with six-day GPV of at least 100 in local currency. The median limits outlier influence but is not a validated new-customer forecast. No separate new-merchant penetration multiplier. No currency aggregation. Refunds, seasonality, merchant concentration and transaction-scope differences may affect outcomes.

Management operating update. Robin reports NZ rollout and concurrent operation are complete, the initial tap-to-pay-only constraint has been resolved through technical changes, and standard card payments are supported. October priorities are NZ penetration and AU concurrent rollout. AU near-100% usage relates to management's current activated-merchant operating view, not a measured whole-market October ratio; no complete October POS denominator is supplied. AU forecast varies remaining-period processing pace and five new merchants, with no additional penetration uplift. These statements do not certify R&D milestone completion.

Scope. This report describes AimerPay commercial launch progress. It does not certify completion of AutoFront.ai R&D milestones. Income scenarios require reconciliation to provider statements and accounting records before being treated as realised income.